IELTS Academic Writing Task 1 with model answer
You should spend about 20 minutes on this task.
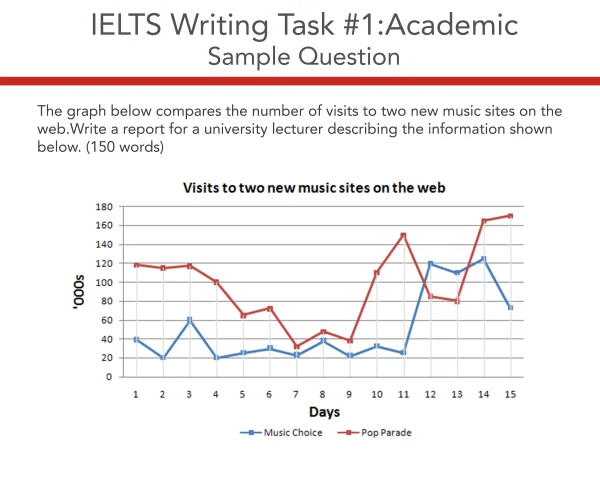
The graph below compares the number of visits to two new music sites on the web.
Summarise the information by selecting and reporting the main features, and make comparisons where relevant.
Write at least 150 Words.
The line graph compares the number of visits to 2 newly established websites, Music Choice and Pop Parade over a period of 15 days.

During the first three days Pop Parade received about 120 thousand daily visits, while Music Choice started well beneath, recording between 20 and 40 thousand visits. Between the third and the ninth day, Pop Parade experienced a gradual downward trend reaching a low of about 40 thousand views, just beyond Music Choice, which during this period levelled off between 20 and 40 thousand. Over the last 6 days visits to Pop Parade increased sharply, reaching a peak of more than 140 thousand visits and obtaining even better results in the last two days, after a short dip. On the other hand, Music Choice soared to 120 thousand only in the 12th period, remained stable the following two days and then dropped to less than 80 thousand visits.
To sum up, the data clearly illustrates that the number of visits to Pop Parade website was higher than that of Music Choice throughout the period with the exception of two days and both websites experienced an upward trend in the number of visits.
Total Words: 192
Task Achievement: 9
Coherence & Cohesion: 9
Lexical resources: 9
Grammar: 9
Overall Score: Band 9
For unlimited feedback with detailed corrections for speaking and writing tasks, sign up for IELTS Twenty20 Online Course today!
Study 20 minutes a day for 20 days and Ace the IELTS exam.
Tags: academic training model answer writing writing task 1
IELTS Score Calculators and Estimators:
Useful FREE resources for IELTS preparation:
- Free IELTS preparation Course
- Free IELTS Model Answers for Academic and General Writing tasks
- Free IELTS Exam Day Cheat Sheet
Tutorials on Essay Writing
- How to identify the main topic and all parts of the IELTS writing task essay?
- How to brainstorm and organise ideas for writing task 2?
Finally, if you need ongoing feedback from an experienced IELTS teacher for your writing or speaking tasks, simply subscribe to one of our IELTS CORRECTION packs

Comments are closed.
The given line graph illustrates information regarding the frequeny of number of visitors in two music website .
Initially , the number of visits to pop parade is about one -hundred- twenty thousand on day one after that it is continuously decline to below fourty thousand on day seven . After that it become paralllel with music choice, as is also show a volatile couse of up and down from initial visit of fourty thousands .However , pop parade visit then jump to one- hunder- fifteen thousand on day eleven while music choice visit remain on same position .
After that, music choice start increasing and inclined to one -hunder -twenty thousand visits and in contrast pop parade visit decline to eighty thousand .Moreover , the visit frequency to music choice remain unstable and again decrease to eighty thousand on day fifteen and in opposite pop parade visits reach to a peak of one -hunderd -seventy thousand in two week period .
Overall , the visits frequency percentage of this two website is highly inpredictable in this two week period although ,pop parade remain the top visited website throughout the time with the exception of two day .Furthermore , the percentage of visiting both musical website remain in upwrad trend .